
The Y-Axis Keeps Moving
Every ECMWF run makes this El Niño bigger. We are out of historical comparisons.

Every time the models run, the forecast gets more extreme. This should be leading every newscast. It isn't.
April 17th was the first time I wrote about the impending super El Niño. I gave an update two months later, and it’s already worth another one. El Niño and La Niña are determined based on the temperature anomalies in the equatorial central and eastern Pacific. They help drive global weather patterns. La Niña is when temperatures are below average and El Niño is when they are above average in this part of the Pacific Ocean. For an El Niño event, temperature anomalies need to be greater than +0.5°C for an extended period.
El Niño is the Spanish word for “the boy,” however some meteorologists have started referring to this incoming one as El Hombre, “the man,” since it appears to be the strongest one on record. Thanks to our addiction to burning oil, coal and gas - we have raised the baseline.
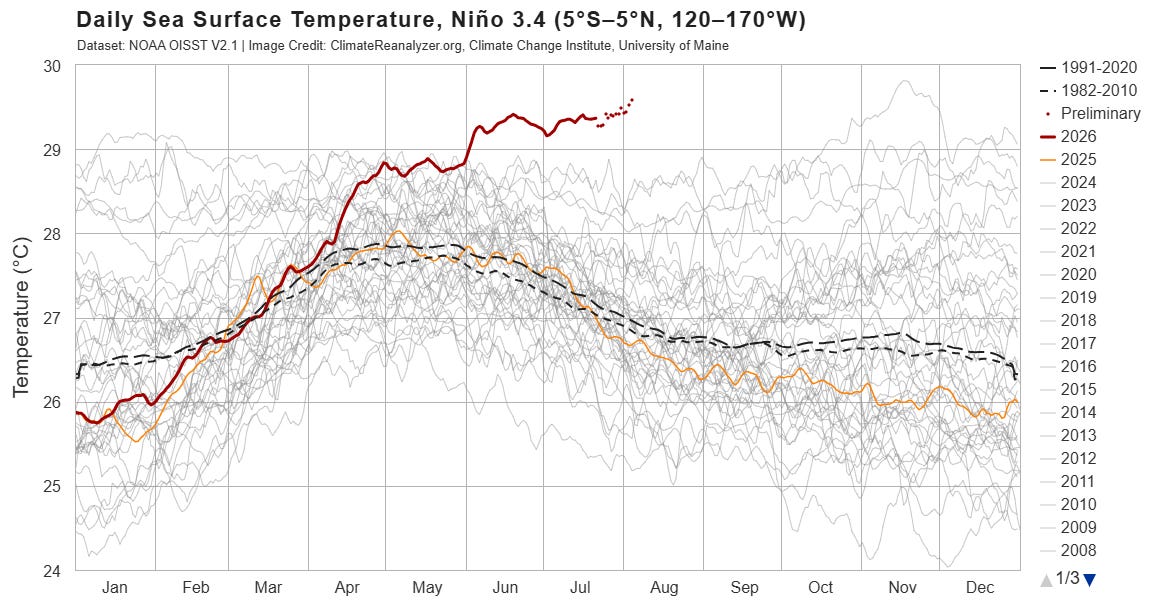
The chart tracks daily sea surface temperature in the Niño 3.4 region, the stretch of equatorial Pacific that forecasters use to define El Niño and La Niña. The red line is 2026, and since roughly March it has run above every other year plotted. What stands out is not just the height but the shape. Niño 3.4 normally peaks in April or May and then cools through the second half of the year, which is the curve every gray line and the dashed 1991-2020 average trace out. 2026 climbed to around 29.4°C in June and simply stayed there, and the preliminary readings for early August are ticking up rather than down. That leaves the current water roughly 2°C warmer than the 1991-2020 daily average for this point on the calendar. For contrast, the orange 2025 line dropped below that same average by July, which is what the tail end of a La Niña looks like.
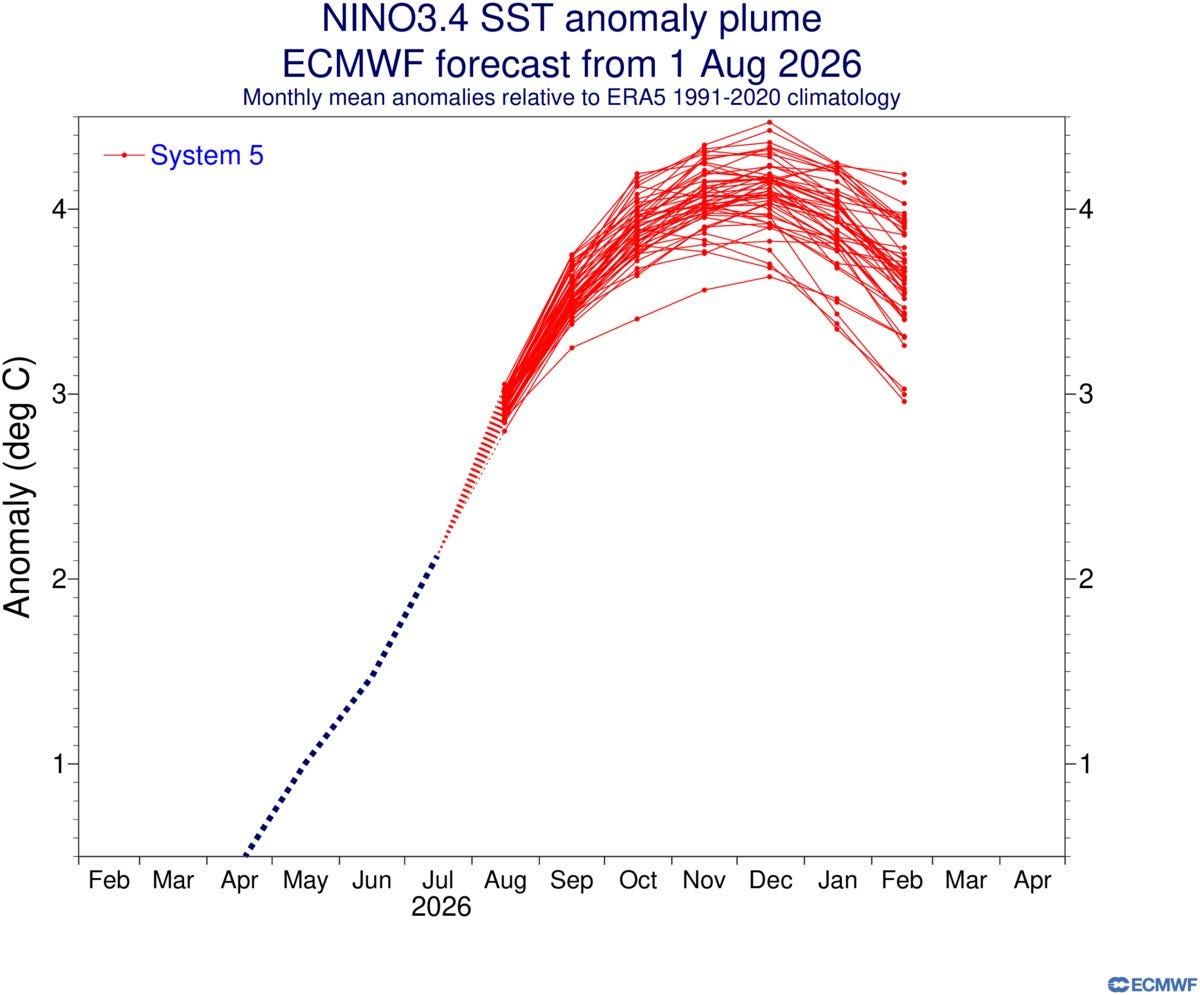
The progression has been the story. Back in the spring, a peak near +2.5°C was already enough to put this event in very strong territory. Then the runs came in at +3, and then +4, and the August 1 ensemble now tops out around +4.5°C. ECMWF has had to keep stretching the y-axis just to fit the forecast on the page. To put that in perspective, the strongest El Niño in the modern record, 2015-16, peaked at +2.6°C. The lowest member on this run, the single most conservative solution the model produced, still lands well above it.
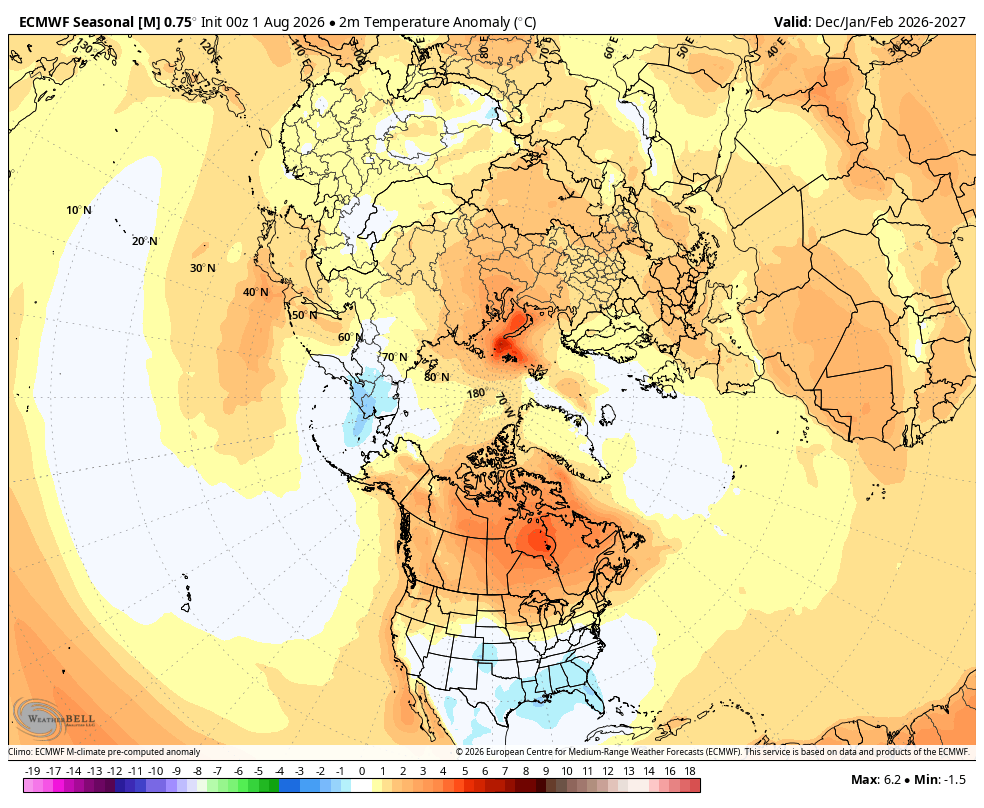
Above is the ECMWF (European model) seasonal forecast initialized August 1, showing the 2-meter temperature anomaly for December through February. It is a textbook El Niño winter signature over North America. Record warmth dominates Canada and the northern tier, running 3 to 5°C above normal across central and eastern Canada, while a cool anomaly sits across the southern United States, most pronounced along the Gulf Coast and into Texas and the Southeast. That north-warm, south-cool split is what a displaced subtropical jet does: it drags storms and clouds across the southern tier and keeps Arctic air bottled up to the north. This usually ends up being a trigger for severe weather through the winter in the South.
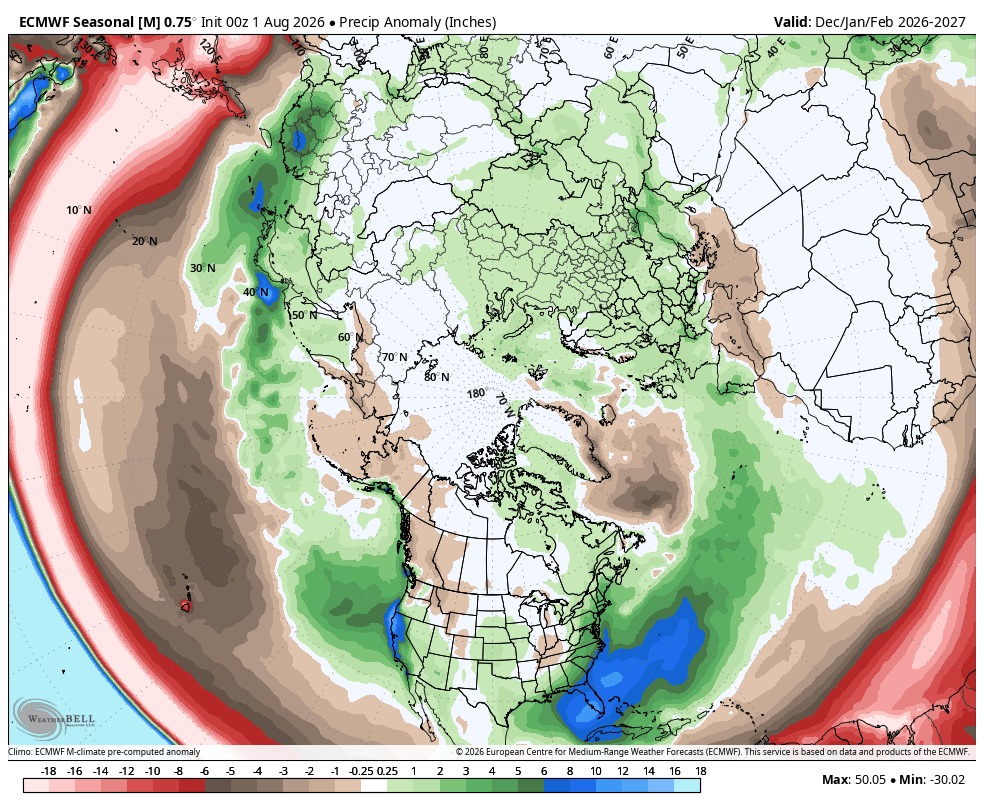
With an active subtropical jet, the wetter signal runs along the southern tier, from the Gulf Coast through the Southeast and up the Eastern Seaboard, though it weakens considerably by the time it reaches New England. Southern California and the Southwest also tend to see more storms in an El Niño winter, which could bring some relief to the Colorado River basin, however a single wet season does not close a structural deficit two decades in the making. The Pacific Northwest is the other side of that coin. El Niño winters typically leave the Cascades milder and drier than normal, and a thin snowpack there is a problem that shows up the following summer, not in February.
The Hottest Year on Record
As of now, 2026 is running as the third warmest year on record globally. El Niño is already strong and will likely peak around New Year's, however the atmosphere does not respond instantly. Global temperature tends to lag the peak by several months, which is why the biggest thermal impact of this event will land after the calendar turns. That timing matters. 2026 could still finish at or near the top of the list, but the year that inherits the full weight of this El Niño is 2027, and it is hard to see how it does not become the warmest year on record.
What Can I Do About It?
I signed an open letter, along with a group of scientists, meteorologists, and public figures, addressed to governors, mayors, and anyone charged with public safety. It was the idea of Adam McKay. You can read it and add your name at yellowdotstudios.com/elninowarning.
Next, call your governor’s office and your mayor. Encourage them to take the necessary steps to keep their residents safe.
Fill up the voicemail boxes of your representatives in Washington. Tell them to fund NOAA and FEMA, and be specific about why. The forecasts in this newsletter exist because people at those agencies collect the data, maintain the buoys, and run the models.
I love being part of this talented group, please support the work of these independant writers and journalists:

I appreciate your call to action Chris. It is overwhelming to read this and be living in these times and end up feeling hopeless. Writing letters and making calls is good. The real action will be turning over the current legislative bodies in states and national to bring in people who are committed to mitigate the damage already done. There is no quick fix or easy way out. We have a long way to go in correcting the current trajectory of raping all the natural resources for profit and greed.
Thank you, Chris. You do a wonderful job of helping us lay people understand a complicated subject. Your sharing is valued more than you can ever know.